
| НАЧАЛО |
| РЕЗЮМЕ |
| БЛОГ |
| ФОТОАРХИВ |
| ДЕРЕВНЯ |
| СЕМЬЯ |
| ЗВЕРИ |
| ПРОГРАММЫ |
| --CATDOC |
| --TCL |
| ТЕКСТЫ |
| СТАТЬИ |
| СОВЕТЫ |
| ИГРЫ |
| ГЕОГРАФИЯ |
| АРХИВ |
| Wiki |
Поиск
fGIS Tcl extension
- Data objects
- Layers
- Regions
- Planchets - map visualisation
- Layer visualisation modes
- External program interface
- Database connectivity
- Tools and bricks
- one that allows GIS data manipulation within Tcl script
- one that allows to view maps in Tk interface.
Data objects
- raster
- An object which represents raster file in Tcl script. Allows
to access data by coordinates, access metadata, stored in raster file
itself, edit raster, and even performs some, relatively simple,
analysis.
raster object is combination of raster file and reclass table, thus you can create many raster objects with different semantics from one raster file thus saving disk space and other system resources.
- vector
- The same thing for vector maps (not written yet)
- palette
- Object which handles color table
- patterns
- Handles set of patterns used to visualize maps
- legend
- Stores table of corespondence between raster object classes and semantic (string) values
- projection
- stores projection information and converts coordinates from lat/long to X/Y and vice versa. It is based on Projection library by Gerald Ian Evenden
Layers
Layer Tcl representation of functional map concept. This is an object, which can return you semantic information for given coordinate, or draw itself as chartographic representation of information it keeps.There are lot of different layer types which are created from different data sources. Classification looks like:
- raster layers
- raster - static data, read from file with tabular legend
- dem - static data with values calculated from file classes by mathematical function
- chart - dynamic data obtained from database query
- vector layers
Needs further investigation
- point layers
- tag - set of points with arbitrary values, plots itself as labeled signs
- diagram - set of points with vector of numeric values each, plotted as bar or pie chart
- observation - set of points which get values from database query
Regions
Region is collection of map, which cover same territory and have same projection, but may differ in spatial resolution. region tcl object exist, becouse there are some properties of region itself - projection and division into subregions. It is high level object, which intended to be manipulited by end-user rather than application programmer, like layer.Planchets - map visualisation
Map visualisation in f(GIS) is handled via special Tk widget, called planchet. Planchet is much like Tk canvas and supports all operation of canvas (Actually, it is derived from canvas). In addition, it has real-world coordinates, and knows its current scale. It also keeps track of layers currently displayed, which allows it to handle panning and scaling.It also have "look feature" which allows it to return values some list of layers (not neccessary ones currently displayed). By default it displays this list in pop-up window upon right mouse click.
Planchet also knows if it has geographical projection defined. If so, it is able to display current latitude/longitude of mouse pointer. Otherwise it just shows real-world coordinates.
To simplify designing of user-interfaces we've introduced a notion of helper widgets. It means that planchet keeps track of several widgets (status line, legend box, zoom/unzoom buttons) and updates their states according to its own state changes. These widgets are not part of planchet and their placement in application GUI is left to application designer.
Additional attributes of planchet are scale ruler and geographic grid, which can be shown or hidden at any time.
Layer visualisation modes
f(GIS) supports various layer visualisation modes. Raster layers can be drawn in opaque colors (which is traditional for raster GIS), in patterns, and symbols. Both symbol and pattern view are transparent and can be overlaid over other layers. They both use same pattern set object to store information about pattern symbol shapes. Difference between pattern and symbol mode is that in pattern mode patterns can be clipped by polygon boundaries when in symbol mode symbol is drown wholly if its central point belong to corresponding class or not drawn at all, and never would be drawn partially.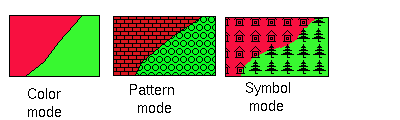
External program interface
Most GIS operations in f(GIS) are implemented as external utilities, which allows to execute them in parallel with main GUI applications. But there should be easy way to invoke them from GUI as well as from Tcl prompt. So, Tcl library provides helper procedures which allows to construct high-level commands, which invokes utility, translating high-level concepts as layers and region to lower-level concepts, which are understood by utilities, and displays its progress in separate window.Database connectivity
It has been said already, that f(GIS) doesn't even try to implement home-grown database management system. Instead, it uses various RDBMS connectivity extensions, available for Tcl. Unfortunately these extensions don't have so unified interface as provided by DBI package for Perl language. So, it was neccessary to develop additional abstraction layer TclDBI which allows to write database-related parts of f(GIS) without regard to particular RDBMS server behind it. (recently tdbc extension appeared to fill this gap).Tools and bricks
Being a large and complicated Tcl application, f(GIS) uses a lot of general purpose procedures, widgets and other reusable pieces of code. In difference with commercial applications, all this tools are open and usable for application developer and even end user. Most notable of them include:- megawidget library by J. Hobbs
- Tabular widget by same author
- Getopt library
- Object orientend extension used for developing layers.